In our samples of Sv 610 and West Greek style Galatian shield bronzes with reported die axes we had only two (of 128) coins, both West Greek types in Copenhagen, that were reported on the compass rose scale in a fashion that could be equivocal with respect to the usual clock face scale (see Table 4 ). We disregard their impact on our quantitative conclusions comparing Sv 610 and West Greek type axis distributions. And we accept the inherent imprecision of die axis reports based on undocumented methods rather than calibrated instruments.
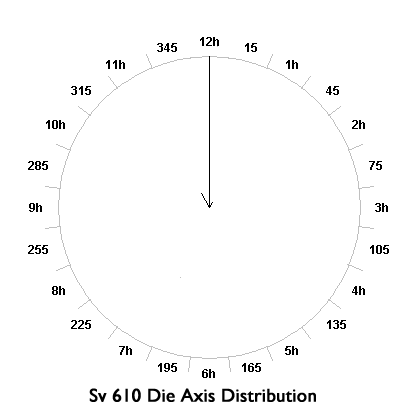
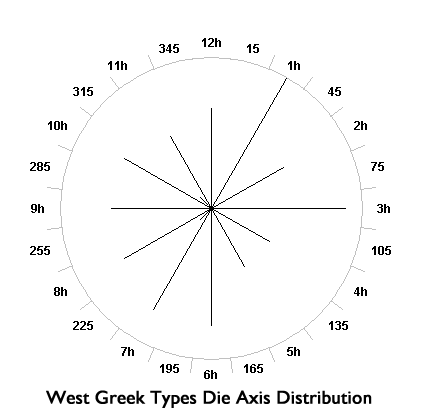
The die axis distributions that help distinguish Sv 610 from the West Greek types are presented in Table 4. Circular distributions of data are amenable to statistical analyses that aid comparisons of the different groups we examined. The data we obtained for die axis distributions of the Sv 610 and West Greek groups were so qualitatively different as to be obvious to the most casual observer. The Sv 610 coins clearly originate from a production technology using fixed dies, while the West Greek coins clearly do not. Circular plots help visualize these two distributions and they are presented here in the following circular distribution graphs for Sv 610 and West Greek types. The plots were created with the aid of an online automated graphing tool, Circplot. The radius of each plot is scaled to the maximum number of coins that fell into one particular orientation.
An important statistic of an angular distribution is a simple calculation of a resultant vector by ordinary weighted vector addition. The resultant vector for the Sv 610 coins is consistent with the die axis data shown in Table 4, having a magnitude of 0.9827 and direction of 358.34 degrees. A perfect 12h distribution would have a magnitude of 1.0 and direction of 360 (= 0) degrees. A uniform (equally distributed) distribution has a resultant vector magnitude of 0.0 and undefined direction. The Sv 610 distribution is clearly uni-modal with no secondary grouping of coins with a die axis orientation other than 12h. The 95% confidence interval for the resultant vector angle is only 5.762 degrees (+/- 2.881 degrees). As we would expect, the Rayleigh test reported by Oriana establishes that uniformity (equivalence to a uniform distribution) p value is 0.0000. The distribution of West Greek types differs greatly, as we see in the scattered die axis distribution seen in Table 4 and the circular plot. The resultant vector has a magnitude of only .0344. The calculated resultant vector is 324.21 degrees (near 11h) but the dispersion about that direction is so great that no meaningful modal direction can be observed, nor can meaningful confidence intervals be obtained for this distribution. This distribution cannot be distinguished from a uniform distribution with statistical confidence (p for uniformity = 0.91). The sample of the West Greek types die axes behaves as if it were randomly drawn from a very large population with equal numbers of coins at each die orientation and we can conclude that the die axes have no net direction.
We noted that Hieron horseman coins share both controls and weight similarities to the Galatian shield bronzes so we now compare the die axis distribution of Hieron horseman coins to either Sv 610 or West Greek types. Fifty-seven Hieron horseman coins from the American Numismatic Society (ANS) as well as an additional fourteen specimens recorded by the author provided die axis data for a total of 71 Hieron horseman coins. Table A2-1 shows the die axis totals of Sv 610 and West Greek types from Table 4 with an additional row with die axes of Hieron horseman coins. The following graph figure provides a circular plot of Hieron horseman coins, scaled so that the radius is 16 corresponding to the maximum number of coins at any particular axis. Because the ANS records die axes on the eight-point compass rose we have almost all the coins in this sample measured in a different fashion than the largely clock-face axis observations for the Galatian shield coins. The distribution looks a bit different than the others in that there are peaks at the 45-degree points intermediate between cardinal directions.
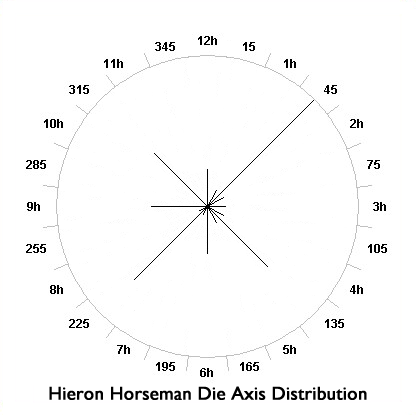
The Hieron horseman coins axis distribution resembles that of the West Greek types in that die axes are widely distributed, reflecting the tabulated distributions. The resultant vector has a magnitude of 0.0614 and direction of 83.919 degrees (near 3h). The statistical results reveal that, though there are apparent peaks in certain directions (apparent multi-modality), this distributions net direction, angular confidence intervals, and resultant vector magnitude are not statistically significant and this distribution is indistinguishable from a uniform distribution with p = 0.7646.
The Hieron horseman die axis distribution is not statistically distinguishable from that of the West Greek Galatian shield varieties, and both are quite obviously different from the die axis distribution of Sv 610 coins. The loose-die Hieron horseman coins reflect a production technology similar to West Greek diobols than either of those coin types resemble that of fixed die Sv 610 coins. This result strengthens our conclusion that the West Greek types are related to the Hieron horseman coinage. A summary of circular statistics of the die axis distributions seen in the preceding tables and figures for all three coin groups is presented in Table A2-3.